


For years, investors have debated whether California's best opportunities lie in the high-appreciation Bay Area or the cash-flow-driven Central Valley. While headlines focus on home prices, sophisticated investors evaluate opportunities based on one key metric: Internal Rate of Return (IRR).
IRR captures the total return generated by an investment — including rental income, appreciation, mortgage paydown, and eventual sale proceeds. So which market wins in 2026? The answer depends on your investment priorities.
Understanding the Return Equation
Real estate returns come from four primary sources:
-
Cash Flow — Monthly income remaining after expenses and debt service
-
Appreciation — Growth in property value over time
-
Loan Amortization — Tenants gradually pay down your mortgage principal
-
Tax Advantages — Depreciation, cost segregation, and 1031 exchanges can significantly enhance after-tax returns
The combination of these factors determines your IRR.
The Bay Area: Appreciation-Driven Returns
Markets such as San Jose, Fremont, Pleasanton, Walnut Creek, and parts of Oakland have historically generated some of the strongest appreciation in the U.S., driven by high-income job growth, limited housing supply, strong tech and healthcare demand, and significant barriers to new construction.
Advantages: Strong long-term appreciation, lower vacancy risk in prime locations, larger equity growth, higher-quality tenant pools.
Challenges: Higher acquisition costs, lower cap rates, often negative cash flow when financed, higher property taxes and insurance.
A typical Bay Area rental purchased today may produce a cap rate between 3% and 5%, relying heavily on appreciation to generate attractive IRRs.
The Central Valley: Cash Flow-Driven Returns
Markets such as Stockton, Manteca, Tracy, Modesto, Merced, and Fresno continue attracting investors seeking stronger rental yields, driven by lower acquisition costs, population growth from coastal migration, and growing logistics and distribution employment.
Advantages: Higher cap rates, stronger cash-on-cash returns, easier portfolio scaling, better debt coverage ratios.
Challenges: Historically slower appreciation, greater exposure to economic cycles, higher management intensity, more competing rental inventory.
Many Central Valley rentals achieve cap rates between 5.5% and 7.5%, creating positive cash flow from day one.
Comparing Potential 10-Year IRRs
Consider two hypothetical $1 million investments:
|
Bay Area |
Central Valley |
|
|
Initial Cap Rate |
4% |
6.5% |
|
Annual Appreciation |
6% |
3.5% |
|
Annual Rent Growth |
4% |
3% |
|
Estimated 10-Year IRR |
10%–13% |
9%–12% |
Estimated 10-Year IRR Comparison
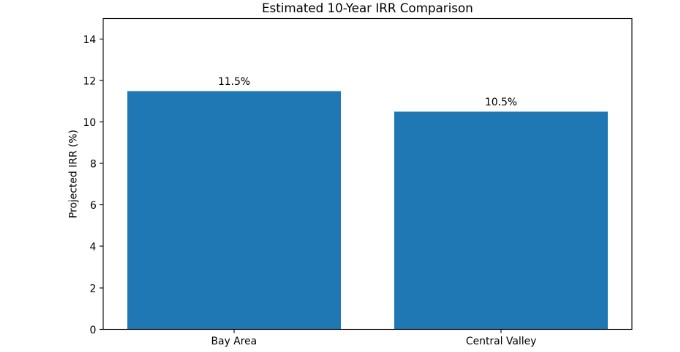
This comparison often surprises investors. While Bay Area properties may achieve higher appreciation rates, Central Valley investments frequently deliver comparable total returns because stronger cash flow contributes significantly to overall IRR.
Where Returns Come From
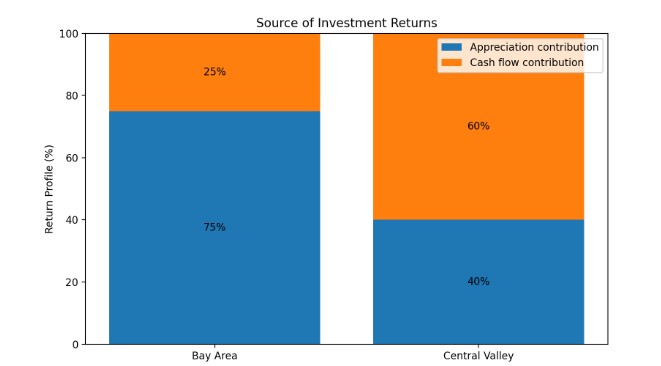
Bay Area investments rely more heavily on appreciation, while Central Valley investments derive a larger share of returns from rental income and debt reduction. Investors seeking immediate income often favor the Central Valley; those focused on long-term wealth creation may prefer the Bay Area.
Typical Cap Rate Comparison
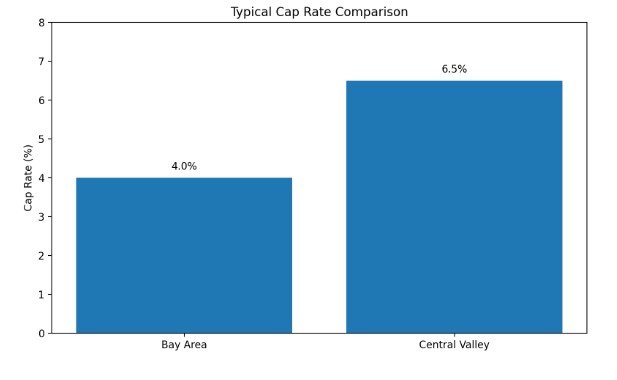
Cap rates are one of the clearest differences between the two regions. A higher cap rate generally means stronger income production relative to purchase price, which improves cash flow and reduces investment risk.
Estimated Purchase Price vs. Monthly Rent by Market
Many investors start with a simple question: How much rent can I collect relative to what I pay? This is where the differences become most noticeable.
[Graph: Estimated Purchase Price vs. Monthly Rent by Market]
Bay Area markets like San Jose and Fremont offer exceptional long-term appreciation, but higher acquisition costs make it difficult for rental income to keep pace with purchase prices. Central Valley markets generally offer lower entry costs and stronger rent-to-price ratios — and an investor can often acquire two or three Central Valley properties for the same capital as one Bay Area property, generating significantly more monthly rental income.
Estimated Purchase Price vs. Monthly Rent by Market
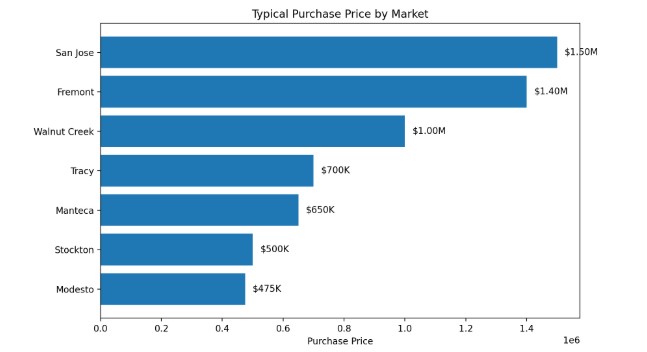
This comparison highlights why many Bay Area investors are expanding their search eastward. While a San Jose property may offer exceptional long-term appreciation potential, an investor can often acquire two or three Central Valley properties for a similar amount of capital and generate significantly more monthly rental income.
Of course, investment decisions should never rest on price and rent alone. Investors should also weigh cash flow, appreciation potential, vacancy risk, local economic growth, property management requirements, regulatory environment, and projected IRR.
California Rental Laws Matter
Regulatory risk is real and affects returns regardless of location. Key factors include:
-
AB 1482 — Annual rent increase caps and just-cause eviction requirements apply to many residential properties statewide
-
Security Deposit Rules — Recent changes have modified requirements for many landlords
-
Local Ordinances — Bay Area cities often layer additional rent stabilization, tenant relocation requirements, and enhanced eviction protections on top of state law
Many Central Valley cities currently maintain a less restrictive regulatory environment, which can reduce compliance costs and operational risk.
Which Market Is Right for You?
Choose the Bay Area if you prioritize long-term appreciation, have substantial capital reserves, and can tolerate lower initial cash flow while building equity.
Choose the Central Valley if you prioritize income today, want stronger cash-on-cash returns, and plan to scale a portfolio with more predictable monthly performance.
Consider both. Many experienced investors build a hybrid strategy — Bay Area assets for appreciation, Central Valley assets for cash flow — balancing long-term growth with reliable monthly income.
Final Thoughts
The real question isn't which market is better. It's which market aligns best with your investment objectives.
At Siri Properties, we help investors evaluate opportunities throughout the Bay Area and Central Valley by analyzing cash flow, appreciation potential, rental regulations, and projected IRR — so every investment fits your goals.
Sources & Methodology
Market observations, rent estimates, cap rate assumptions, and investment comparisons are based on publicly available housing and investment data, industry research, and local market experience. Primary sources include: California Association of Realtors (CAR), CRMLS, Zillow Home Value Index, Zillow Rental Market Reports, Redfin Data Center, Freddie Mac Primary Mortgage Market Survey, Federal Reserve Economic Data (FRED), U.S. Census Bureau, Bureau of Labor Statistics (BLS), CoStar Market Analytics, CBRE Northern California Multifamily Market Reports, Marcus & Millichap California Multifamily Market Reports, Urban Land Institute (ULI), National Association of Realtors (NAR), and County Assessor and Recorder Offices throughout California.
Additional insights were derived from Siri Properties' direct experience managing, selling, and analyzing residential investment properties across San Jose, Fremont, Walnut Creek, Tracy, Manteca, Stockton, Modesto, Merced, Lodi, and Fresno.
Important Disclosure
All cap rates, appreciation assumptions, rent projections, and IRR examples in this article are intended for educational and illustrative purposes only. Actual investment performance may vary based on purchase price, financing terms, market conditions, vacancy rates, operating expenses, property condition, local regulations, tax considerations, and future economic conditions. Investors should conduct independent due diligence and consult qualified real estate, legal, tax, and financial professionals before making any investment decisions.